Abstract
Overview
This technical report presents a comprehensive fashion recommendation system that analyzes individual physical characteristics—personal color, face shape, and body type—to provide customized fashion suggestions. The system addresses the growing demand for personalized services in the fashion industry.
Key Components
Personal Color Analysis
The system extract RGB values of skin area of a face image, and convert it to HSV values and Lab color space. The system uses K-means clustering to classify users’ skin tones into four seasonal types (Spring, Summer, Autumn, Winter) by analyzing HSV values and Lab color space. This classification helps recommend colors that enhance the user’s natural complexion.
Face Shape Recognition
We use an EfficientNetB4-based deep learning model. The model was built based on the EfficientNetB4 network pretrained on the ImageNet dataset. A GlobalAveragePooling2D layer was applied to the output of EfficientNetB4, and the resulting output was passed through a Fully-connected layer to classify into five face shapes. We initially trained the model with the EfficientNetB4 backbone frozen for 25 epochs, learning rate 1e-3 and kernel regularizer l2(1e-3), and then fine-tuned the entire network by unfreezing all layers and using a low learning rate(1e-4) with 20 epochs. We use EarlyStopping(monitor=’val_accuracy’, patience=10,restore_best_weights=True) callbacks. The system identifies five face shapes (heart, long, oval, round, square) with 75.8% accuracy. These classifications inform recommendations for clothing styles and necklines that complement facial features.
Body Shape Measurement
The system employs MediaPipe’s Pose Landmark technology and Rembg’s removing background technology to extract key body measurements and proportions. It calculates ratios between shoulders, waist, hips, and chest to classify users into different body types, enabling recommendations that enhance body proportions.
Recommendation Engines
Two approaches were implemented:
A Random Forest model
This model predicts ratings based on user characteristics and clothing attributes(appropriate wearing situation, fit, color, mood, style, season). We trained the model with fashion preferences and recommendation data by year. This model has test RMSE scores of 0.759 for men and 0.773 for women. It also inorporates user feedback to continuously improve recommendation quality. The user feedback system was implemented by adding the (user characteristic - clothes attributes - rating) data to the existing training data and learning a new Random Forest model when the user gave a rating.
A content-based collaborative filtering system
This model uses cosine similarity to find similar clothing items based on keyword of the clothes. We use TF-IDF Vectorizing to embedding the keyword. We collected (clothes - keyword) data from K-Fashion data. We assign fashion keywords based on the physical characteristics and the model recommend clothing items that share similar keywords. Alternatively, the model recommend items that match the keywords entered by the user.
Conclusion and Applications
The possibility of personalized services was confirmed by establishing a system for recommending customized fashion based on the physical characteristics of users such as personal color, face type, and body type. In particular, the Random Forest-based recommendation system recorded high prediction accuracy, and the recommended quality improvement function reflecting user feedback played an important role in continuously improving the performance of the system. These results showed the importance of customized services and the possibility of how the personalized recommendation system can be applied in the fashion industry.
This technology enables highly personalized fashion recommendations that consider individual physical attributes rather than just following general trends. The web interface allows users to upload photos or manually input their characteristics to receive tailored fashion suggestions.
Future Directions
Future enhancements include expanding the dataset, incorporating real-time trend analysis, and potential integration with e-commerce platforms to create a seamless shopping experience.
Data
- fashion preferences and recommendation data by year
- This data is the outcome of a project by the National Information Society Agency (NIA) of Korea.
- K-Fashion
- This data is the outcome of a project by the National Information Society Agency (NIA) of Korea.
- Face Shape dataset
- Korean bodyshape data
- This data is the outcome of a project by Korean Agency for Technology and Standards (KATS), Ministry of Trade, Industry and Energy (MOTIE) of Korea.
Tables
| man dataset | woman dataset | |
|---|---|---|
| Train dataset | 0.304 | 0.312 |
| Test dataset | 0.759 | 0.773 |
Table 9: Root Means Squared Error(RMSE) of Random Forest-based recommendation system.
Figures
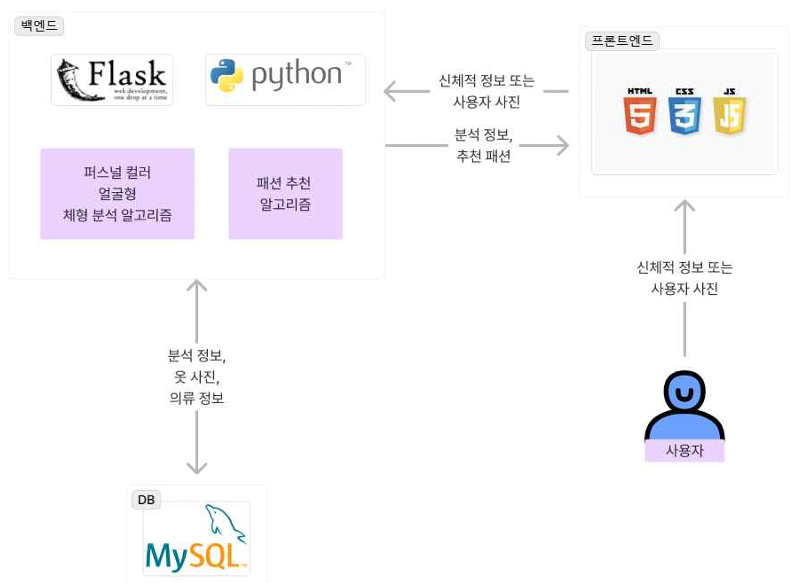
Figure 1: System Architecture
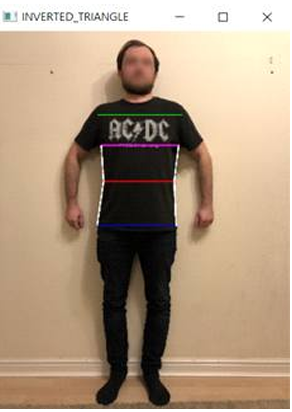
Figure 2: estimated measurements and locations for bust, waist, shoulder, and hips using MediaPipe. The dataset is (6)
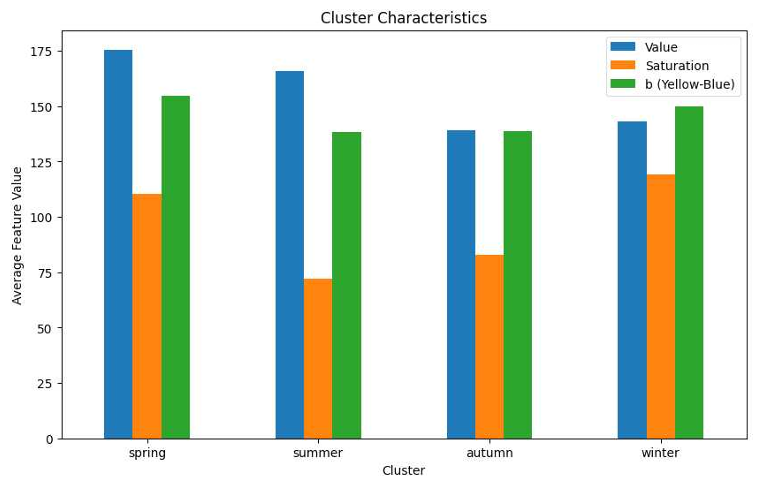
Figure 3: The average color values for each personal color season (Spring, Summer, Autumn, Winter) identified through K-means clustering. The three parameters shown are Value (brightness), Saturation (color intensity), and b channel (yellow-blue axis). Spring shows high brightness and moderate intensity with warm undertones. Summer exhibits high brightness but low intensity with cool undertones. Autumn features lower brightness with warm undertones. Winter combines moderate brightness with higher intensity and cooler undertones.
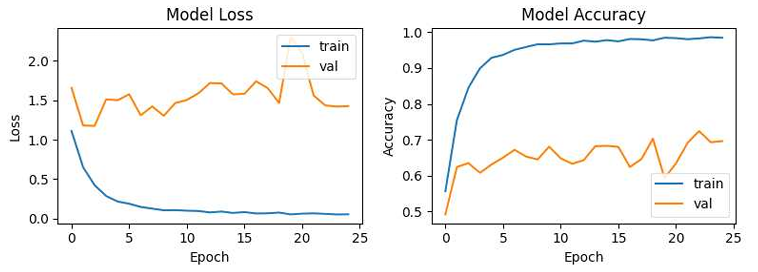
Figure 4: Learning graph of Faceshape classification model based on EfficientNetB4. We first trained the model 25 epoches with freezing the weights of pretrained EfficientNetB4. At the final epoch, training accuracy was about 98.51 percent and test accuracy was about 69.61 percent. This model classify the faceshape(Heart, Oblong, Oval, Round, Square) from single face image
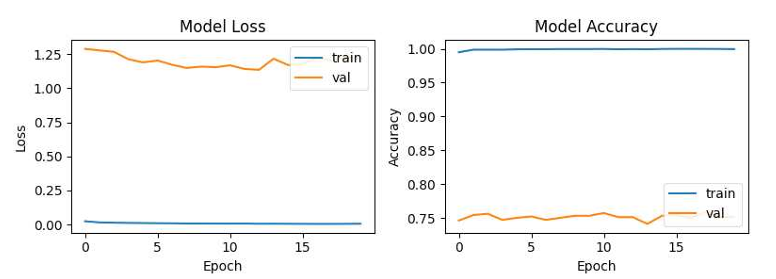
Figure 5: Learning graph of Faceshape classification model based on EfficientNetB4 without freezing the pretrained model. We trained the model 20 epoches. Training accuracy was about 99.93 percent and test accuracy was about 75.83 percent at the best weights
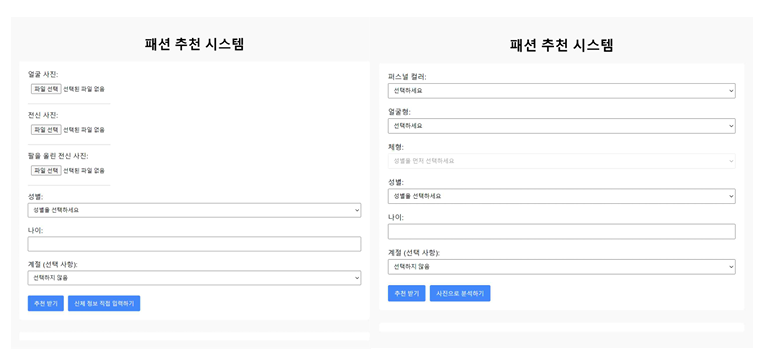
Figure 6. Fashion recommend system webpage
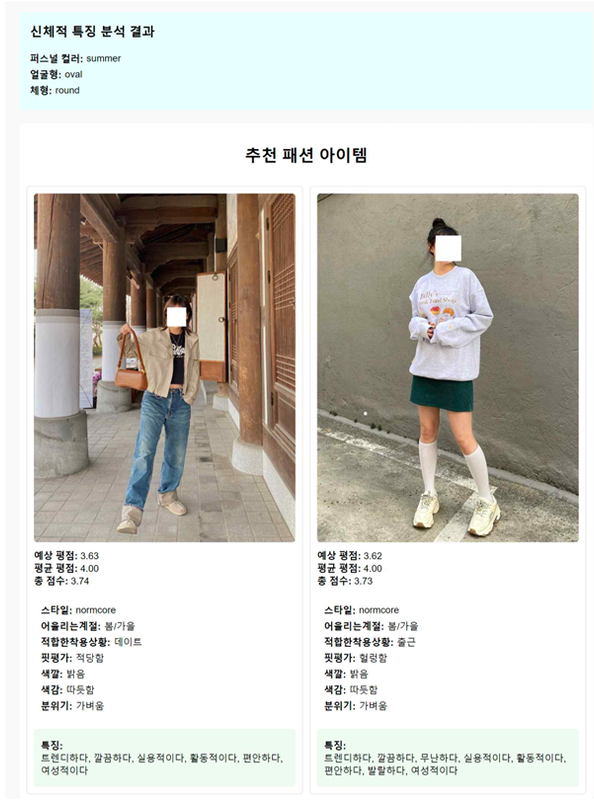
Figure 7. Fashion recommendation result
Acknowledgements
This graduation project was conducted as part of the 2024 Early-Year Capstone Design Program of the School of Information and Computer Engineering. It was carried out as an industry-academic collaboration project, with partial guidance and advice provided by an employee of NAVER Webtoon. This work has been registered with the Korea Copyright Commission (Registration No. C-2024-042740), with Research and Business Development Foundation of Pusan National University listed as the copyright holder. The author participated in the work as the creators.
References
- Yun-Seok Jung, “A Study on the Quantitative Diagnosis Model of Personal Color,” Journal of Convergence for Information Technology, Vol. 11, No. 11, pp. 277-287, 2021. (in Korean) doi: https://doi.org/10.22156/CS4SMB.2021.11.11.277
- Jong-Suk An, “A Study on Effective Image Making Depending on Hair Style and Neckline,” Jounal of The Korean Society of cosmetology, Vol. 15, No. 1, pp.342-351, 2009. (in Korean) Available at https://www.riss.kr/link?id=A76494548
- Soo-ae Kwon, Fashion and Life, Gyohakyungusa, 2016. ISBN: 9788935405558
- “2023 Consumption Trend Series - 03 Personalized Services,” MezzoMedia Available: https://www.mezzomedia.co.kr/data/insight_m_file/insight_m_file_1605.pdf (downloaded 2024, May. 19)
- So-young Lee, “Personal Color Tone Type and Categorization of Harmonious Colors According to Skin Color,” M.S. thesis, Graduate School of Cultural and Information Policy, Hongik Univ., Seoul, South Korea, 2019. (in Korean) doi: https://www.doi.org/10.23174/hongik.000000024122.11064.0000288
- Trotter, Cameron Patrick; Peleja, Filipa; Santos, Alberto de; Dotti, Dario (2023). Human Body Shape Classification Dataset. Newcastle University. Dataset. doi: https://doi.org/10.25405/data.ncl.19307300.v1
BibTex
@software{Fashion_recommendation_personal,
  author = {Seonghoon Lee and Taehun Kim},
  month = {11},
  title = {Fashion recommendation system based on personal characteristics},
  url = {https://github.com/pnucse-capstone-2024/Capstone-2024-team-24},
  year = {2024}
}
@misc{Fashion_recommendation_personal_webpage,
  title = {Fashion recommendation system based on personal characteristics webpage},
  author = {Seonghoon Lee and Taehun Kim},
  year = {2025},
  url = {https://minchocoin.github.io/capstone-team-24-page/},
  note = {Accessed on May 27, 2025}
}
Authors
- Seonghoon Lee
- B.S in electrical and computer engineering from Pusan National University
- Taehun Kim
- B.S in electrical and computer engineering from Pusan National University